
Learn about what information ‘gold-standard’ testing can provide us on players, and understand how this relates to performance.
If you are fortunate enough to have access to laboratory testing equipment, you will find that a few tests can give you a huge amount of information that can be used to profile players, and can also be used for prescribing individualised training.
The first test we will discuss is the VO2max test performed on a treadmill, using gas analysis. This method is considered the gold standard for VO2max testing, and the data collected from the test can give coaches and staff a detailed insight into a player’s physical capability. Once the gas analyser has been calibrated and set up appropriately, this test is conducted in a fairly simple way:
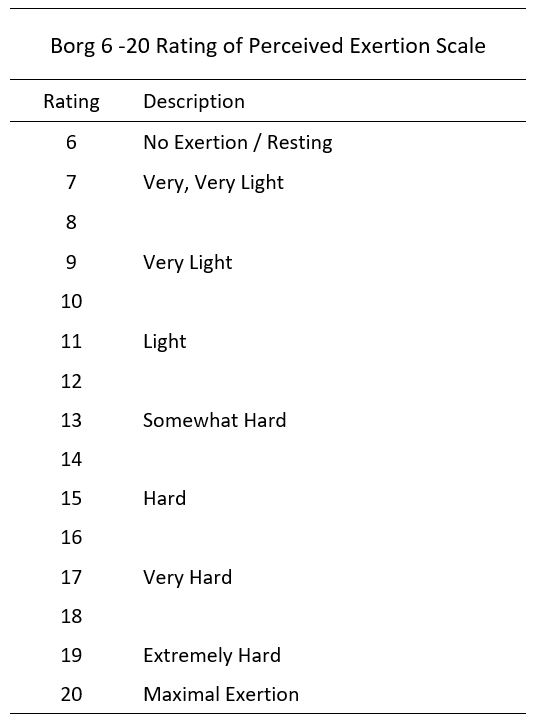
1 – The player begins running on a treadmill set at an initial speed of 13 km·hr-1 (1% gradient), Rating of Perceived Exertion (RPE) is measured throughout (typically using a Borg 6-20 Scale).
2 – Speed is increased by 1 km·hr-1 every minute.
3 – The test runs until volitional exhaustion of the player, and usually lasts between 9 – 12 minutes.
4 – VO2max is then measured as the peak VO2 uptake, either in L or ml·kg·min-1.
It is worth noting that both Heart Rate Max and Velocity at VO2max data can be obtained from this test also. Heart Rate Max is simply the maximum value of heart rate recorded during the test; Velocity at VO2max is the final velocity at exhaustion. Both values can be used to prescribe training when extensive lab equipment is not available.
The second test we will discuss is a lactate profile test. This test is conducted in a similar way to the VO2max test, as it is an incremental test on a treadmill, using gas analysis, but also measures blood lactate samples:
1 – The test begins with an easy initial speed (around 8 km·hr-1), and is maintained for a 3 – 5 minute interval.
2 – Speed is increased gradually (1 – 2 km·hr-1) every 3 – 5 minute interval.
3 – The test lasts until blood lactate levels rise above 4 mmol·L.
4 – After each interval, blood samples are taken from a finger, and analysed using a blood lactate analyser. Heart rate, running speed, and RPE should also be measured at each interval.
Once we have collected lactate samples, we can plot a graph of blood lactate concentration against running speed.
The picture opposite shows a typical lactate profile. We would expect to see a constant level at the slower speeds (> 1 mmol·L), then a steady increase up until around 4 mmol·L. After this we would see a sharp increase in lactate levels that is unsustainable.
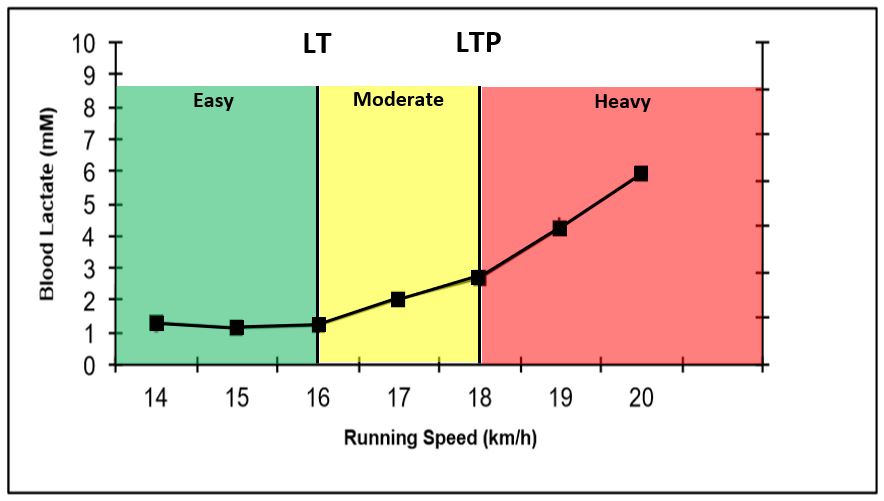
We can interpret the graph using what is known as the Lactate Threshold (LT) and the Lactate Turnpoint (LTP). LT is the exercise intensity where there is a steady increase in resting blood lactate levels. LTP is the intensity at which blood lactate levels sharply rise, to an unsustainable level.
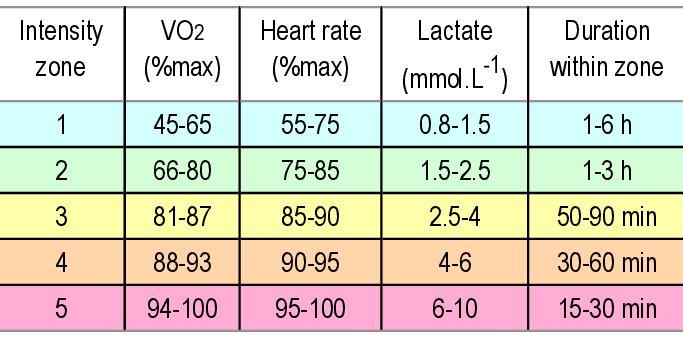
This data can be used to prescribe exercise at various intensities, with LT being moderate intensity, and above LTP being considered heavy exercise. You can use these two tests to plan training in accordance with the ‘Five-Zone Scale’ shown below.
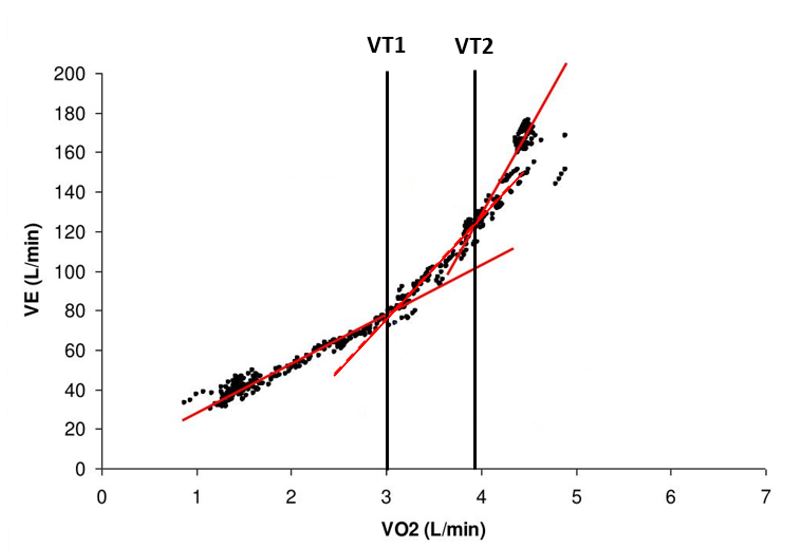
The final lab-based test we will discuss is the Ventilatory Threshold test. This can be conducted alongside the lactate profile test using the gas analyser. It follows the same protocol and gives us another indicator of where the true LT and LTP occur. This is because the first ventilatory threshold VT1 occurs at the same point as LT, and the second ventilatory threshold VT2 occurs at the same point as LTP. VT1 is characterised as the point where minute ventilation (VE) increases at a rate faster than the rate of O2 consumption. VT2 is characterised as a further increase in VE from the linear pattern after VT1. As this is difficult to visualise, the graph below shows what a typical ventilatory threshold test’s results may look like. From this graph we can see what speed or time corresponds to the VO2 consumption at each identified threshold to see whether the data agrees.
Linking this to the lactate profile test, VT1 shows an increase in VE as blood lactate accumulates in the body faster than it can be cleared and therefore the player will begin to breathe faster to get rid of excess CO2 produced by the buffering of the acid. The increase in VE at VT2 is due to the rapidly increasing concentration of blood lactate in the body with the increased exercise intensity and is when the player will be hyperventilating as breathing is no longer able to remove the excess CO2.
Why Use These Tests?
There are a number of practical uses for the data you can gather during these tests, especially regarding prescription of training and monitoring physical performance. As soccer is an intermittent sport, it is important that players are well trained aerobically, as well as anaerobically, and these need to be monitored to check players baseline scores, and to see whether training has been effective in producing the desired physical adaptations.
Visit the On-Pitch Training section to learn about how the data from these tests can be applied to soccer training.
